01
Project Overview
This report presents headline superstore sales and profit indicators with state-level filtering.
Retail Analytics
A superstore dashboard analyzing orders, sales, profit, product categories, regions, delivery modes and customer segments.
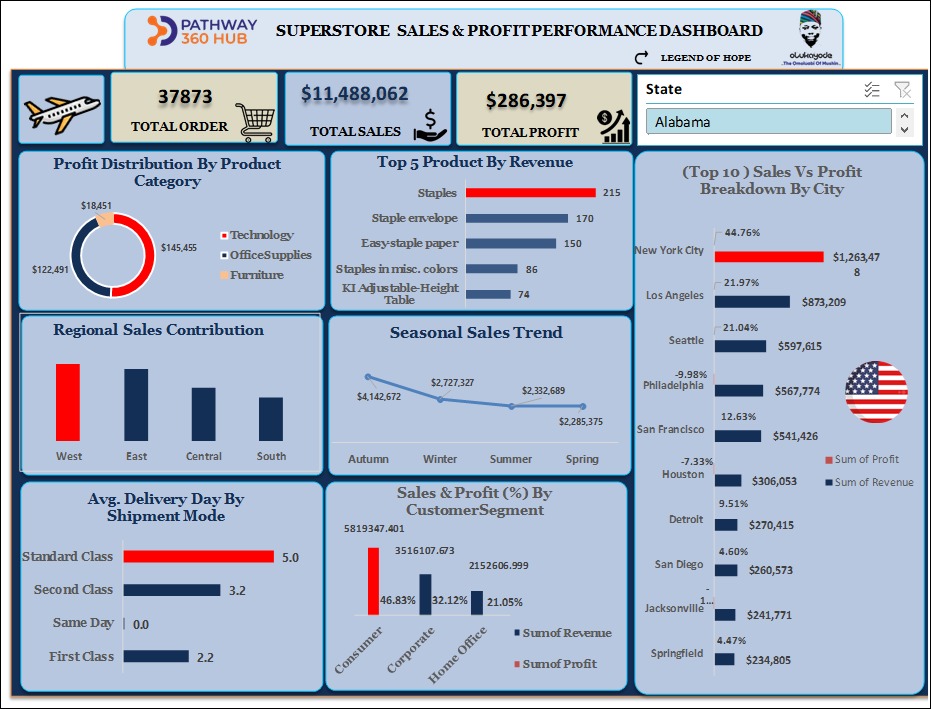
This report presents headline superstore sales and profit indicators with state-level filtering.
The dashboard compares product categories, regional contribution, seasonal trends, delivery modes and customer segments.
The report helps reveal the products, regions and customer groups contributing most to performance.